PyReason Hello World!
Welcome to PyReason! In this document we outline a simple program that demonstrates some of the capabilities of the software. If this is your first time looking at the software, you’re in the right place.
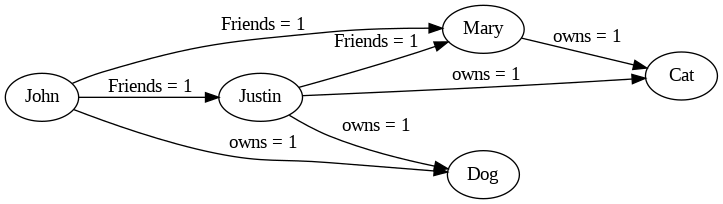
The following graph represents a network of people and the pets that they own.
Mary is friends with Justin
Mary is friends with John
Justin is friends with John
And
Mary owns a cat
Justin owns a cat and a dog
John owns a dog
PyReason needs a few things to run:
A Graph (or knowledge base)
Rules (that determine how things can change in the graph in time)
Facts (that specify initial conditions in the graph. This can be specified in the graph or externally)
Graph
We can create a graph in two ways:
Using Networkx
Using GraphML
Let’s look at how to create a graph using Networkx
import networkx as nx

# ================================ CREATE GRAPH====================================
# Create a Directed graph
g = nx.DiGraph()

# Add the nodes
g.add_nodes_from(['John', 'Mary', 'Justin'])
g.add_nodes_from(['Dog', 'Cat'])

# Add the edges and their attributes. When an attribute = x which is <= 1, the annotation
# associated with it will be [x,1]. NOTE: These attributes are immutable
# Friend edges
g.add_edge('Justin', 'Mary', Friends=1)
g.add_edge('John', 'Mary', Friends=1)
g.add_edge('John', 'Justin', Friends=1)

# Pet edges
g.add_edge('Mary', 'Cat', owns=1)
g.add_edge('Justin', 'Cat', owns=1)
g.add_edge('Justin', 'Dog', owns=1)
g.add_edge('John', 'Dog', owns=1)
Reading the graph from a file is also possible. The file should be in GraphML format.
<?xml version='1.0' encoding='utf-8'?>
<graphml
    xmlns="http://graphml.graphdrawing.org/xmlns"
    xmlns:xsi="http://www.w3.org/2001/XMLSchema-instance" xsi:schemaLocation="http://graphml.graphdrawing.org/xmlns http://graphml.graphdrawing.org/xmlns/1.0/graphml.xsd">
    <key id="owns" for="edge" attr.name="owns" attr.type="long" />
    <key id="Friends" for="edge" attr.name="Friends" attr.type="long" />
    <graph edgedefault="directed">
        <node id="John" />
        <node id="Mary" />
        <node id="Justin" />
        <node id="Dog" />
        <node id="Cat" />
        <edge source="John" target="Mary">
            <data key="Friends">1</data>
        </edge>
        <edge source="John" target="Justin">
            <data key="Friends">1</data>
        </edge>
        <edge source="John" target="Dog">
            <data key="owns">1</data>
        </edge>
        <edge source="Mary" target="Cat">
            <data key="owns">1</data>
        </edge>
        <edge source="Justin" target="Mary">
            <data key="Friends">1</data>
        </edge>
        <edge source="Justin" target="Cat">
            <data key="owns">1</data>
        </edge>
        <edge source="Justin" target="Dog">
            <data key="owns">1</data>
        </edge>
    </graph>
</graphml>
We then load the graph from the file using the following code:
import pyreason as pr
pr.load_graphml('path_to_file')
basic image
Both representations of the graph are equivalent and can be used interchangeably.
Rules
The rule we want to add is the one that determines popularity. We want to add a rule that says that if a person has a friend who is popular and who has the same pet as they do, then they are popular.
popular(x) : [1,1] <-1 popular(y) : [1,1] , Friends(x,y) : [1,1] , owns(y,z) : [1,1] , owns(x,z) : [1,1]
Since PyReason by default assumes bounds in a rule to be [1,1], we can omit them here and write:
popular(x) <-1 popular(y), Friends(x,y), owns(y,z), owns(x,z)
The rule is read as follows: - The head of the rule is popular(x) and the body is popular(y), Friends(x,y), owns(y,z), owns(x,z). The head and body are separated by an arrow and the time after which the head will become true <-1 in our case this happens after 1 timestep.
To add this rule to PyReason, we can do the following:
Add the rule directly
Add the rule from a file
To add the rule directly, we must specify the rule and a name for it.
import pyreason as pr
pr.add_rule(pr.Rule('popular(x) <-1 popular(y), Friends(x,y), owns(y,z), owns(x,z)', 'popular_rule'))
The name helps understand which rules fired during reasoning later on.
Adding the rule from a file is also possible. The file should be in .txt format and should contain the rule in the format shown above.
popular(x) <-1 popular(y), Friends(x,y), owns(y,z), owns(x,z)
Now we can load the rule from the file using the following code:
import pyreason as pr
pr.add_rules_from_file('rules.txt')
Facts
Facts are initial conditions that we want to set in the graph.
In the graph we have created, suppose we want to set Mary to be popular initially.
import pyreason as pr
pr.add_fact(pr.Fact(name='popular-fact', component='Mary', attribute='popular', bound=[1, 1], start_time=0, end_time=2))
The fact indicates that Mary is popular at time 0 and will remain so until time 2.
Running PyReason
The complete code for the basic tutorial is in the file basic_tutorial.py.
The main line that runs the reasoning in that file is:
interpretation = pr.reason(timesteps=2)
This line runs the reasoning for 2 timesteps and returns the interpretation of the graph at each timestep. We can also skip the timesteps argument and let PyReason run until the convergence is reached.
Expected Output
Before checking the output , we can check manually what the expected output should be. Since we have a small graph, we can reason through it manually.
At timestep 0, we have Mary to be popular.
At timestep 1, Justin becomes popular because he has a popular friend (Mary) and has the same pet as Mary (cat).
At timestep 2, John becomes popular because he has a popular friend (Justin) and has the same pet as Justin (dog).
At timestep 3, no new nodes become popular and the reasoning stops.
The output of the reasoning is as follows:
 TIMESTEP - 0
  component    popular
0      Mary  [1.0,1.0]


 TIMESTEP - 1
  component    popular
0      Mary  [1.0,1.0]
1    Justin  [1.0,1.0]


 TIMESTEP - 2
  component    popular
0      Mary  [1.0,1.0]
1    Justin  [1.0,1.0]
2      John  [1.0,1.0]
The output is as expected and the reasoning has converged. The reasoning has been successful. We also output two CSV files detailing all the events that took place during reasoning (one for nodes, one for edges)